
As we head into the holiday season, all eyes are on the consumer. Household spending makes up the largest share of the U.S. economy, and the stretch between Thanksgiving and year-end is one of the most closely watched periods for gauging its health. This year, that spending is happening against a challenging backdrop: gas prices and housing costs. These are two of the most visible expenses households face, and together they have pushed a measure of financial strain to near its highest level in over 15 years. Still, consumers have continued to open their wallets, adjusting where they shop more than how much they spend.
Today’s weekly market commentary examines these pressures households are facing, why spending has held up better than many expected, and what that may potentially mean for the broader economy heading into 2027.
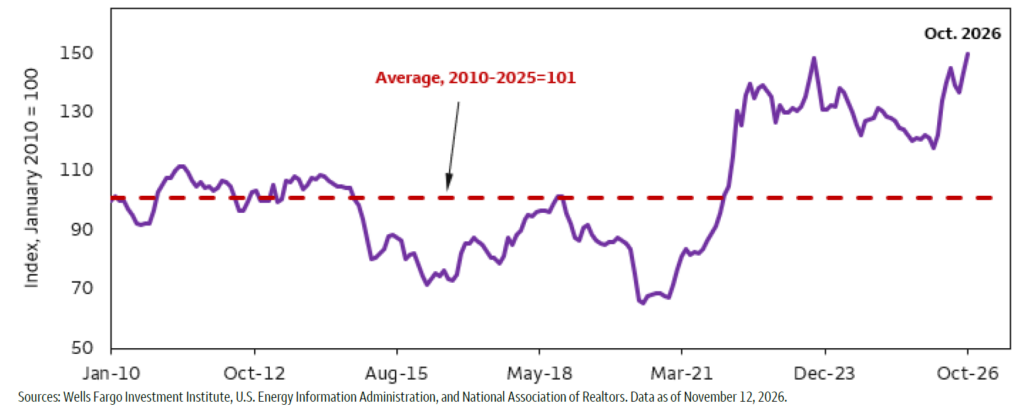
The enclosed chart tracks the Wells Fargo Investment Institute household “misery index” from January 2010 through October 2026. This “misery index” blends two costs that households feel directly and frequently – what they pay at the pump and how hard it is to afford a home. The index is built from these two pieces, averaged together:
- Nominal gas prices, indexed so that January 2010 equals 100. If gas costs 30% more than it did in January 2010, that component reads 130.
- The inverse of a housing affordability index. The affordability index compares median family income to the income needed to qualify for a mortgage on a median-priced home. When homes become less affordable (higher prices, higher mortgage rates, or incomes falling behind), that index falls, so its inverse rises. Flipping it ensures both components move in the same direction, and when it moves up, that means there is more strain on households.
The red dashed line represents the average from 2010 through 2025 which is 101. The solid purple line then represents the actual reading. As can be seen from the data, from 2010 to 2014, the index hovered around the average. There was then a sharp drop late in 2014 through 2016. This correlates with a drop in oil prices (and subsequently gas prices) alongside affordable housing. There was then a partial recovery from 2017 through 2019 as gas prices recovered, and home prices and mortgage rates rose, but then in 2020, the low point on the chart was reached. This was, of course, due to a pandemic-era demand collapse which sent gas prices sharply lower along with mortgage rates falling to record lows.
There is then a steep rise from 2021 to 2023 where both components of the index spiked with gas prices increasing, home prices rapidly growing, and mortgage rates almost doubling as the Fed raised interest rates. From there, the index was elevated but easing from 2025 through the middle of 2026, but then there was of course a renewed spike, climbing to its highest level in October of this year.
Now historically, the index has moved inversely to consumer spending growth, meaning that when household strain rose sharply, spending growth tended to slow. But the piece explains that in recent years that relationship has weakened. “Strength in household demand has been tied to the recent stock market boom, moderate employment growth, and inflation’s periodic declines that have boosted real (inflation-adjusted) income gains.” – WFII Chart of the Week 11/17/2026
But importantly, in terms of what this may mean for investors, the piece states in the close, “economic tailwinds have loosened the link between spending and household ‘misery,’ even as affordability pressures remain elevated. Pressure on household finances has had less impact on overall spending growth than on spending patterns, contributing to a shift toward discounters and private-label products, for example. For now, however, we believe resilient consumers will support broader economic growth, even as elevated interest rates weight on housing affordability and the economy’s other credit-sensitive areas.” – WFII Chart of the Week 11/17/2026
1. Our “misery index” is based on the average of indexed nominal gas prices and the inverse of a house affordability index, base=2010.
We would ask that you review the attached piece at your convenience and please let us know if you have any questions or if you would like to discuss it further. And as we always end this correspondence, please remember that regardless of current momentum and regardless of the key takeaways in this weekly perspective, we will continue to monitor and manage with a thoughtful approach based on your specific long-term objectives.
Thank you for your continued confidence and look forward to speaking soon.


