
In September, the Federal Reserve raised interest rates for the first time in more than three years. This has brought Fed Monetary policy and interest rates back into the headlines, causing concern for some investors. While tighter monetary policy is often viewed as a headwind for stocks, the historical record tells a more nuanced story. Today’s weekly market commentary examines past rate-hiking cycles to potentially provide some context for today’s environment.
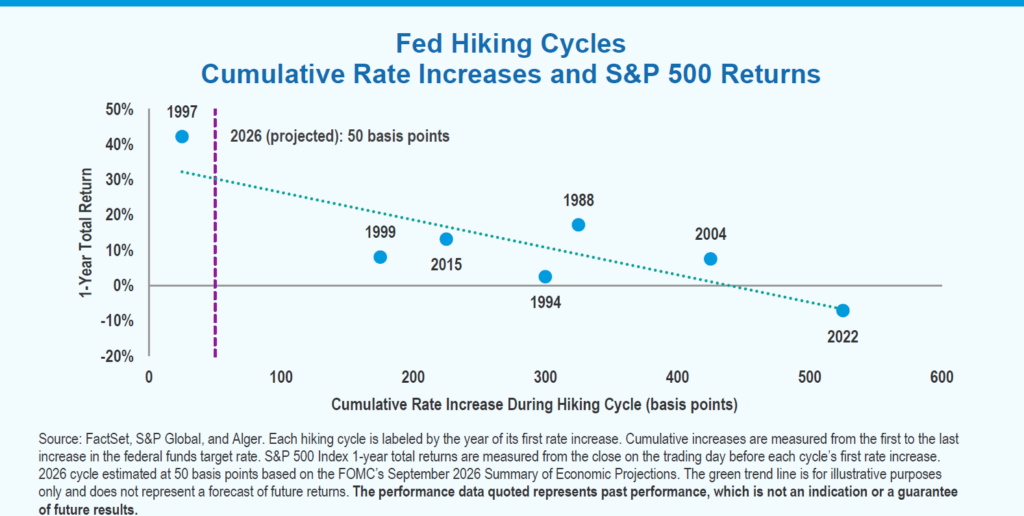
The enclosed chart plots Fed rate-hiking cycles, showing the cumulative rate increases in each cycle along with the 1-year total return of the S&P 500 Index. The horizontal axis shows how much the Fed raised rates over the entire cycle, measured in basis points. For reference, 100 basis points equals 1 percentage point. The vertical axis shows the S&P 500’s total return over the year following the first rate increase. Each blue dot then represents a different hiking cycle, labeled by its starting year.
For example, the chart shows that the 1997 cycle involved just one quarter-point increase, and stocks returned roughly 42% over the following year. The 2022 cycle ultimately involved 5.25 percentage points of increases, and stocks lost roughly 7% during the year after the first hike. The downward-sloping dotted line illustrates the historical pattern: larger rate-hiking cycles have generally been associated with weaker stock returns. However, the dots vary considerably, so this is a relationship – not a rule or proof that rate increases alone caused those results.
Finally, the vertical dotted purple line marks the projected 2026 rate increases of 50 basis points. Its position suggests a relatively modest cycle, but it does not predict, nor can it predict, a stock market return. Additionally, the chart compares the full cycle’s rate increases but only the first year’s stock performance, so those two measurement periods can be different.
However, as the piece states in the close, “based on the Fed’s own projections, the current hiking cycle is expected to total just 50 bps, mild by historical standards and much more akin to 1997 than to 2022. In our view, the U.S. economy is well equipped to absorb it. Consumer spending and employment remain healthy, and business investment is growing several times faster the U.S. GDP, driven in large part by the artificial intelligence buildout. As a result, we believe the economy and equity market can continue to expand, and that secular growth equities driven by innovation rather than the direction of interest rates may be well positioned in this environment.” – AOM 493
The takeaway is that markets rarely respond to a single data point in isolation; scale, timing, and economic conditions all shape the outcome. Staying invested with a well-diversified plan has historically served investors better than reacting to any one Fed decision.
We would ask that you review the attached piece at your convenience and please let us know if you have any questions or if you would like to discuss it further. And as we always end this correspondence, please remember that regardless of current momentum and regardless of the key takeaways in this weekly perspective, we will continue to monitor and manage with a thoughtful approach based on your specific long-term objectives.
Thank you for your continued confidence and look forward to speaking soon.


